
Find a place to start.
Use scene maps and grouped contributors to choose the object or material worth investigating.
Explore the maps ↗Rendering analysis for Unity
Find rendering hotspots. Understand what's behind them. GPUSight connects visual scene maps, object evidence and GPU tests so you can choose your next optimization with context.
Unity Editor extension Version 1.0.0
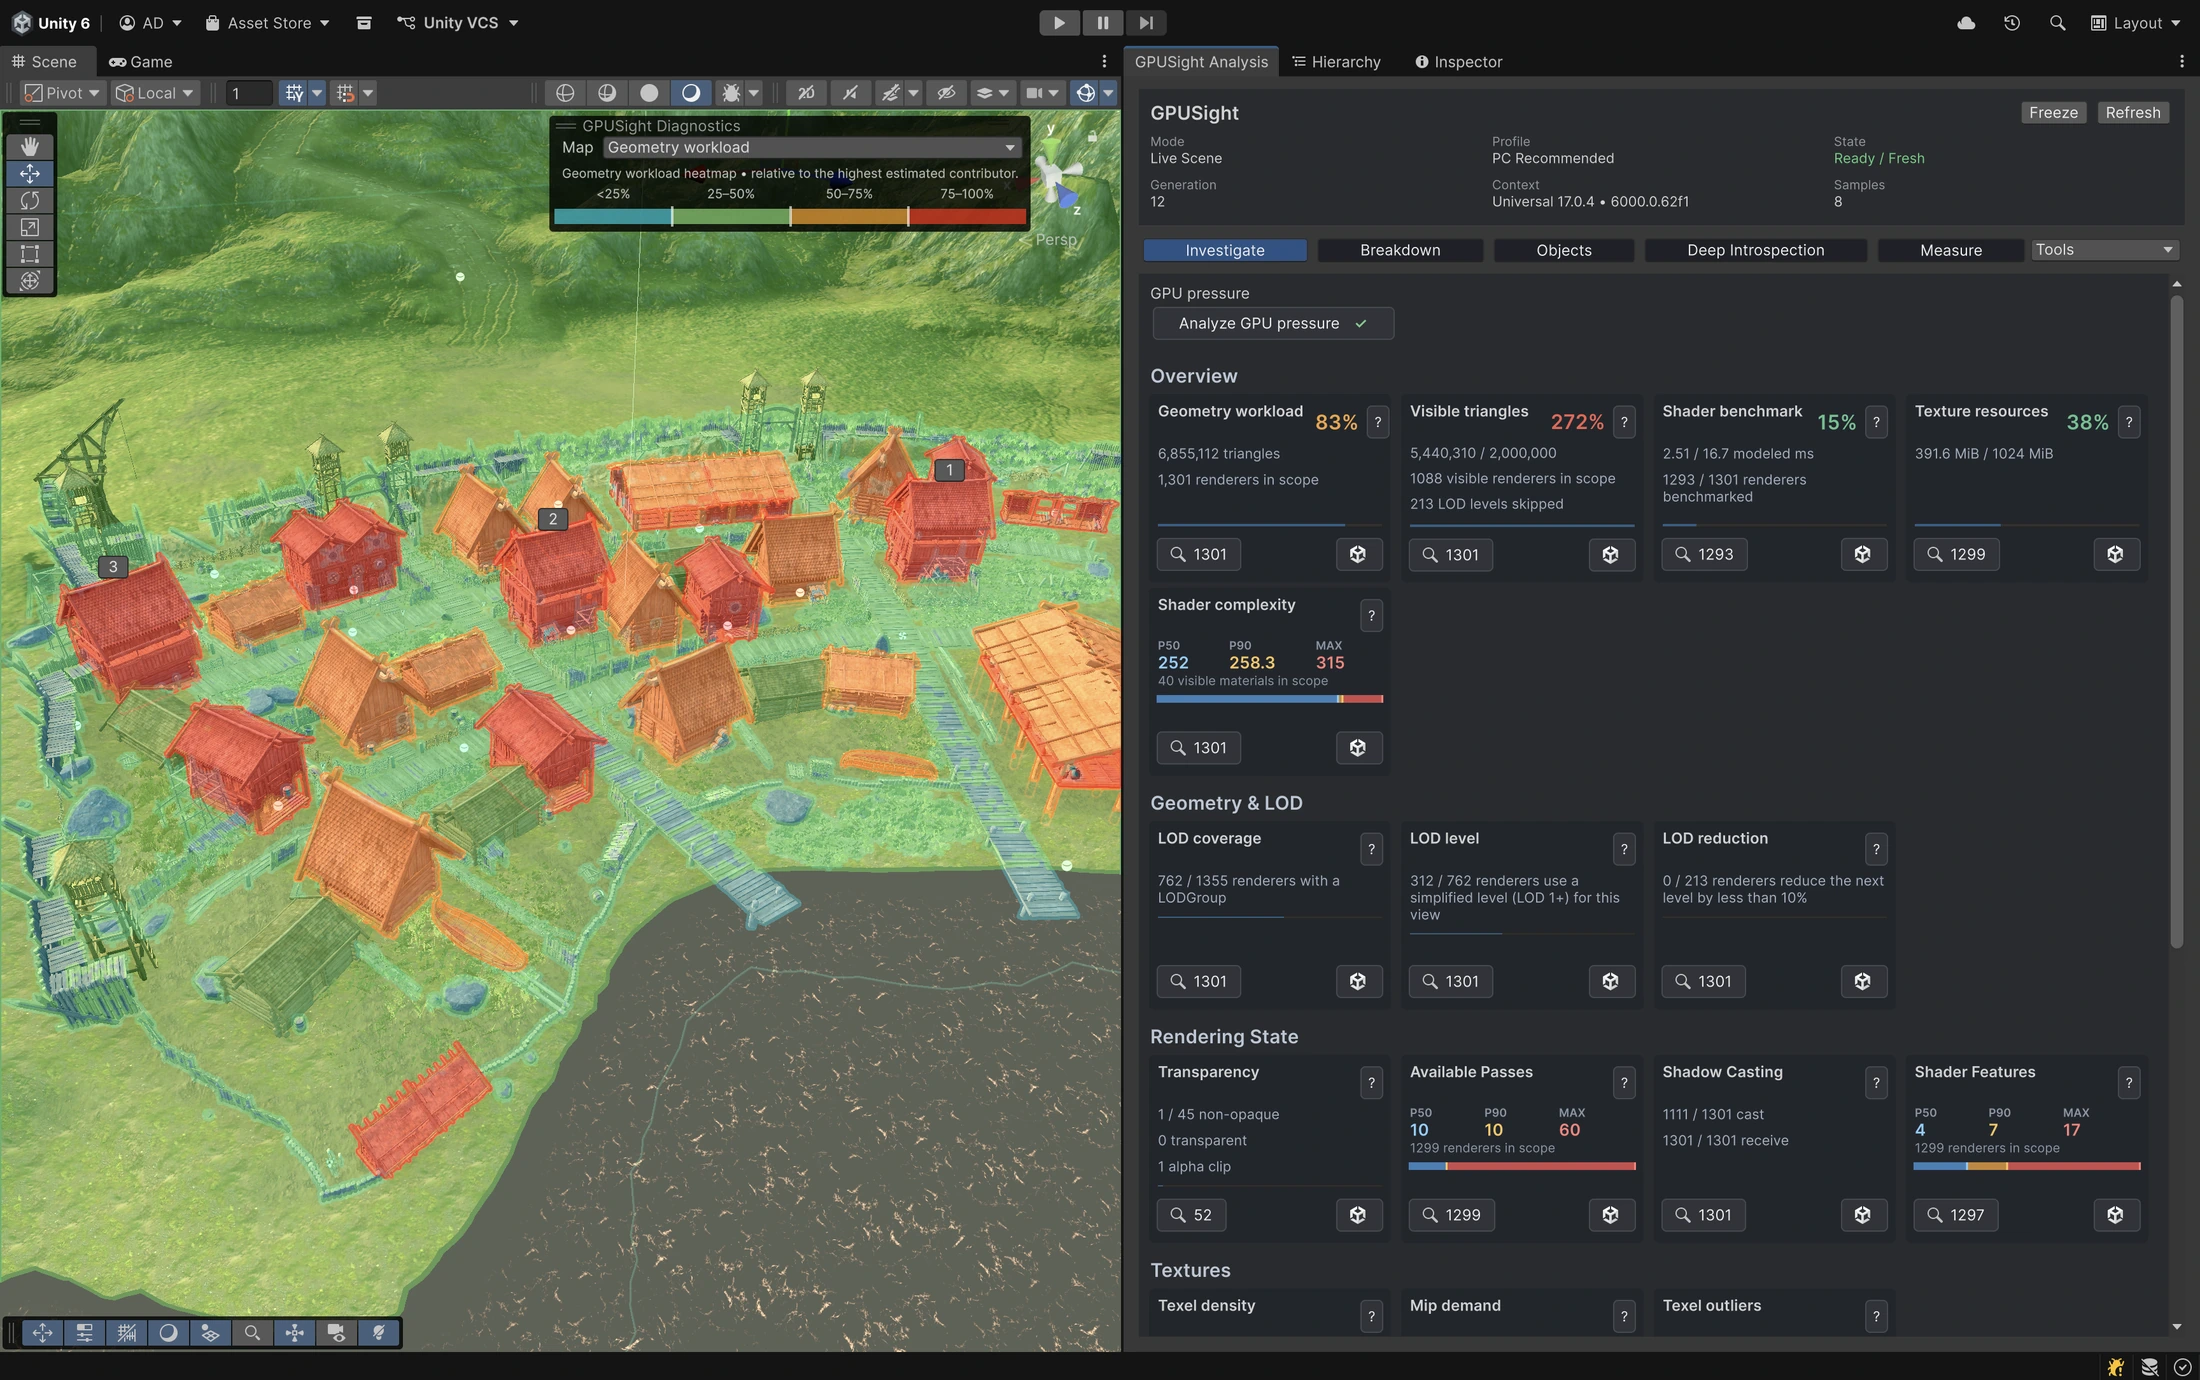
See the big picture
Find areas worth investigating directly in Scene View. Switch maps to reveal different aspects of the rendering workload, then follow a finding into the objects and materials behind it.
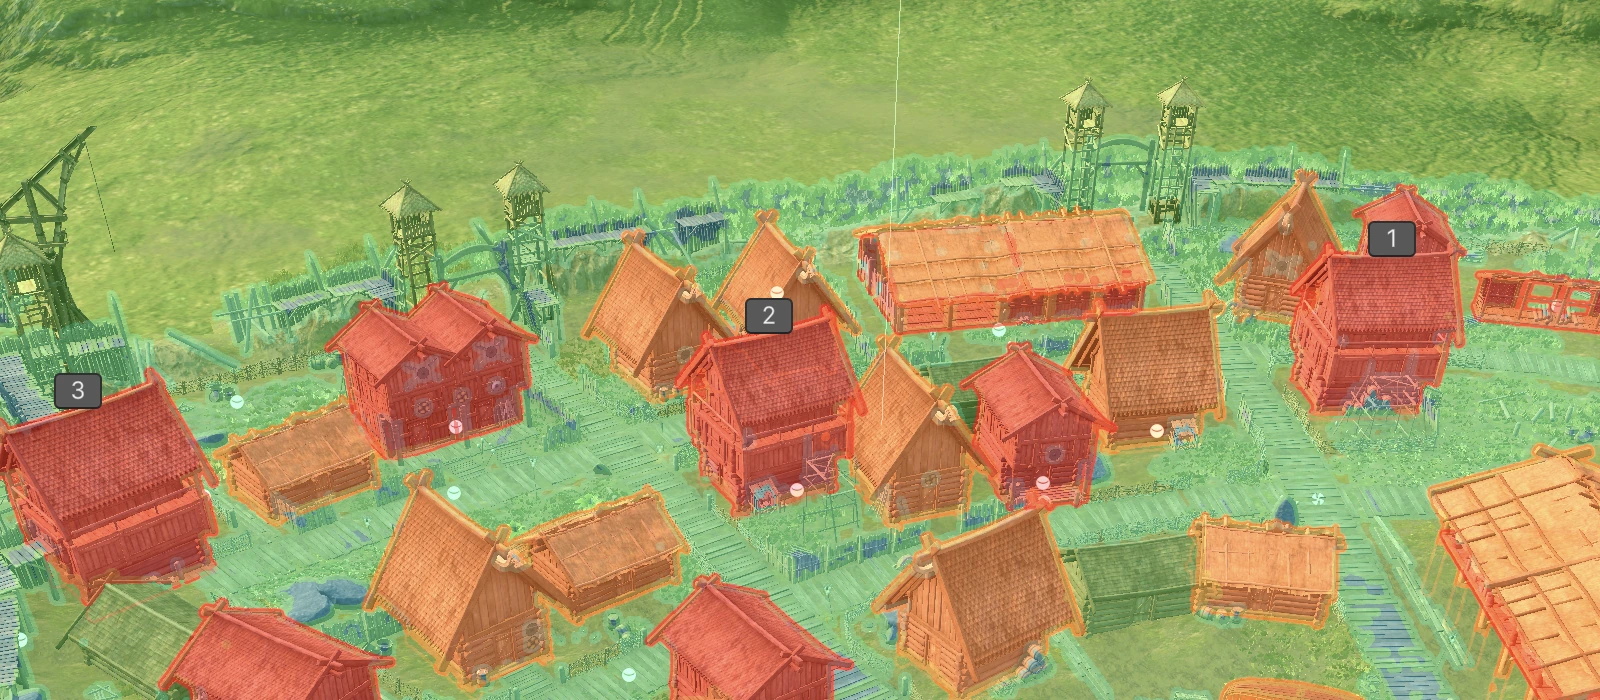
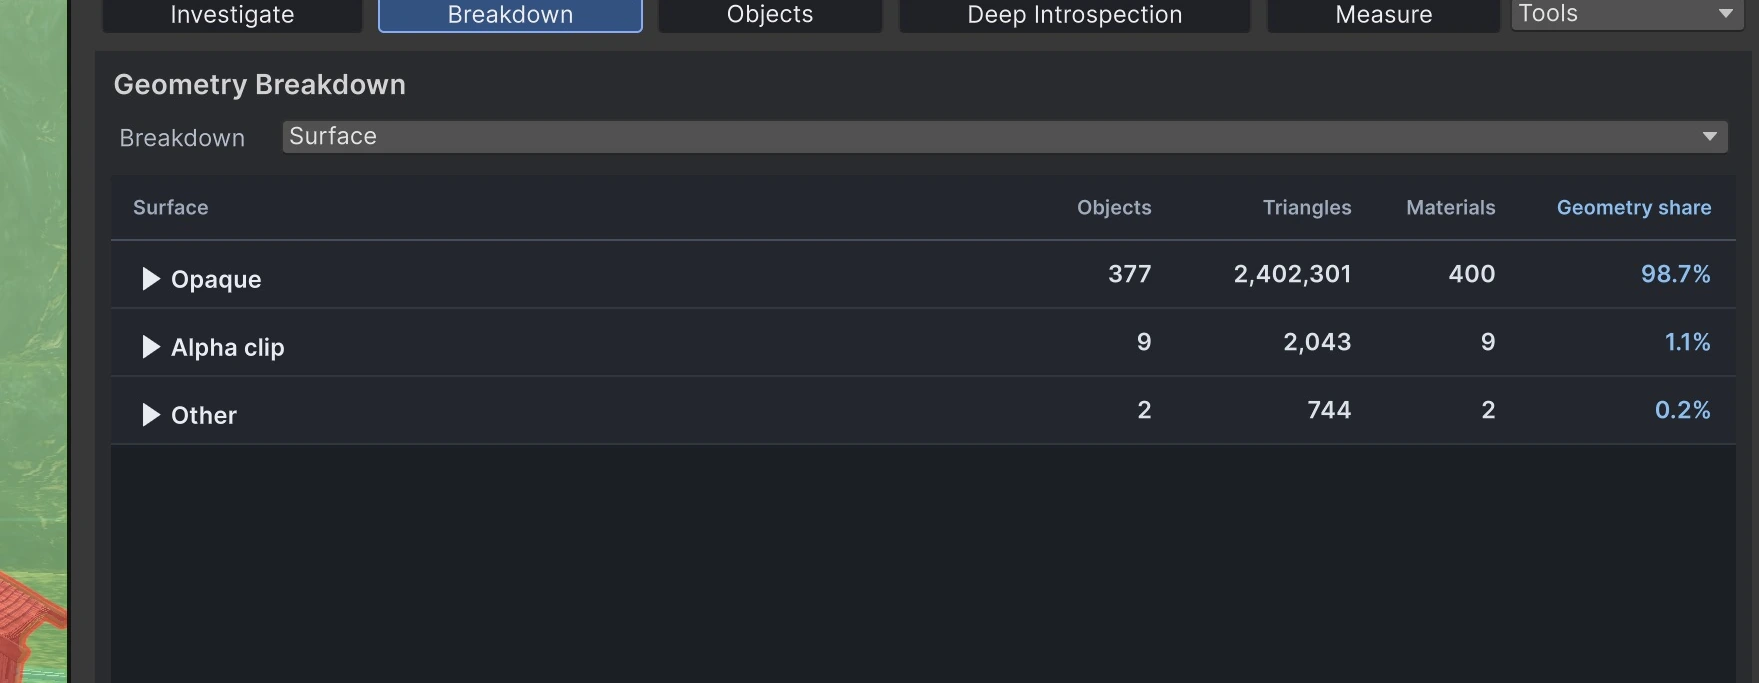
See how geometry workload is distributed across the scene. Follow highlighted contributors into their object and material evidence.
Workload signal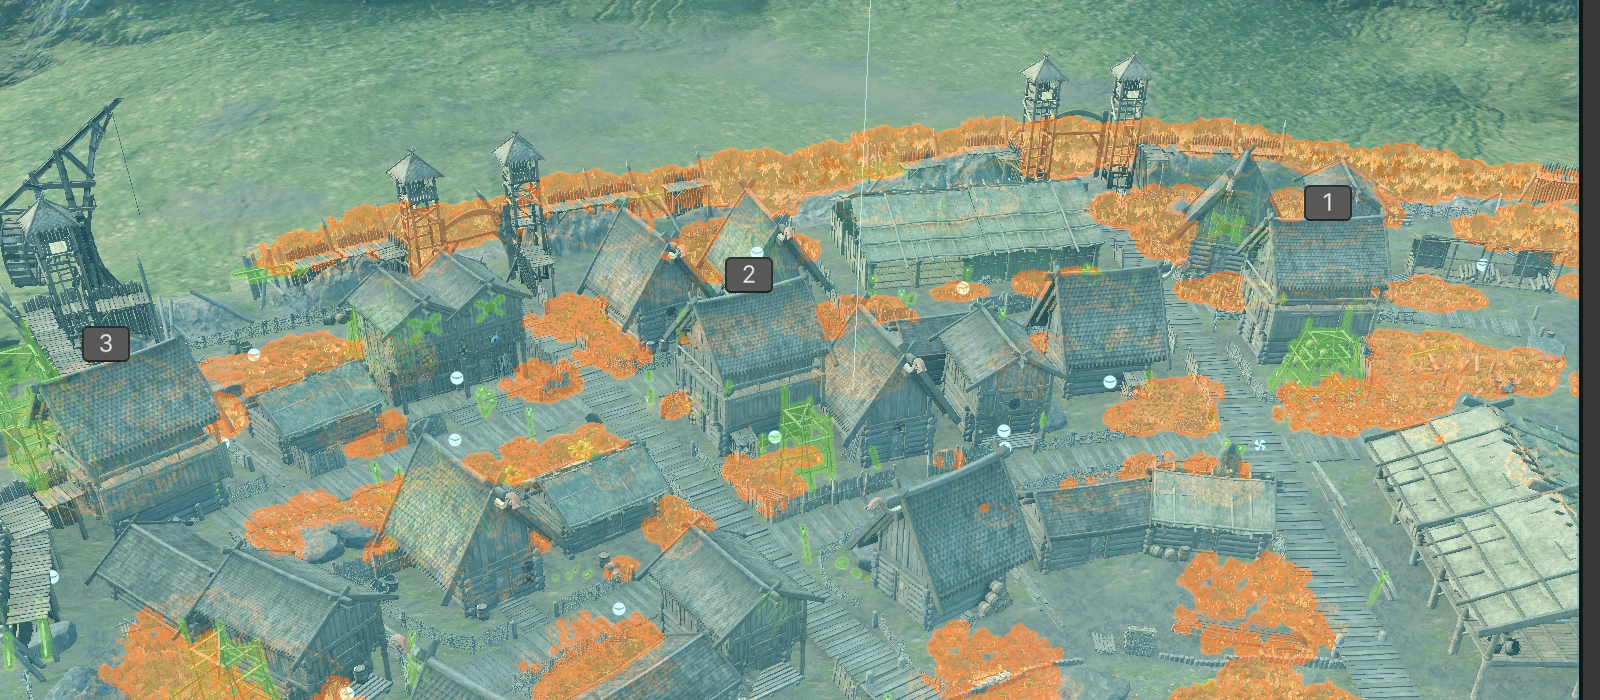
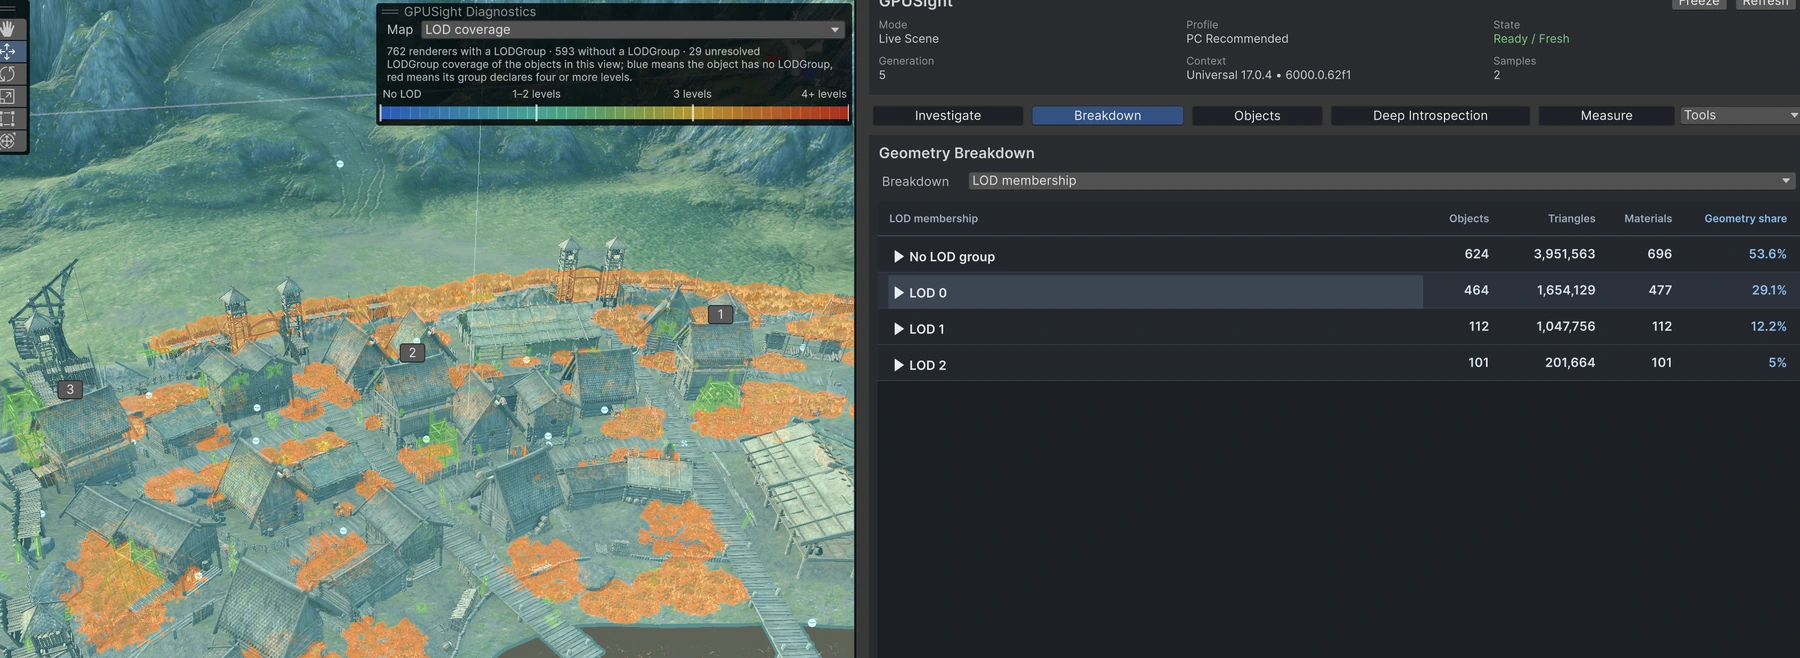
Find objects without an LODGroup and see how many levels are declared. Continue with LOD-level and reduction views to inspect transitions.
Scene facts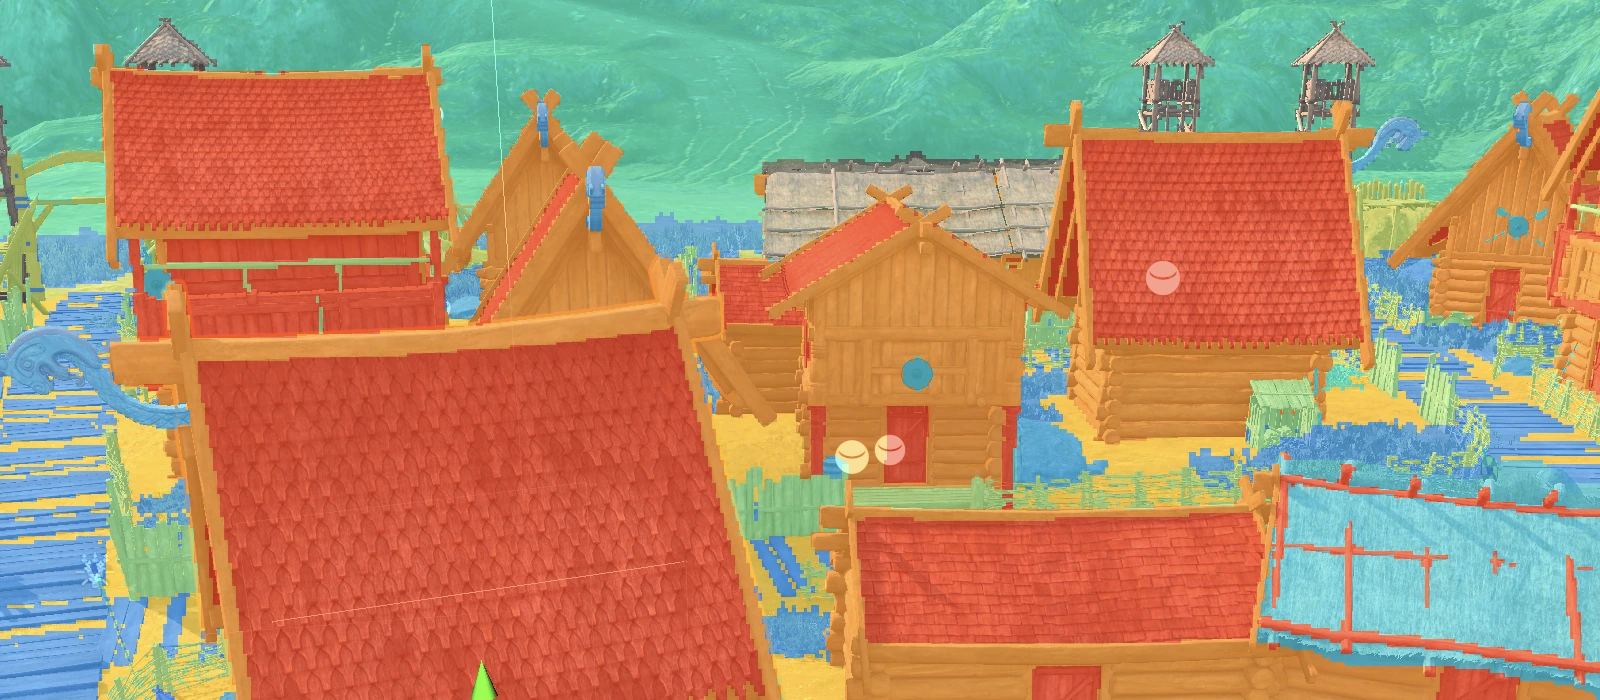
Find surfaces associated with large texture resources, then inspect the material bindings. Native allocation data is currently available on Metal.
Resource evidence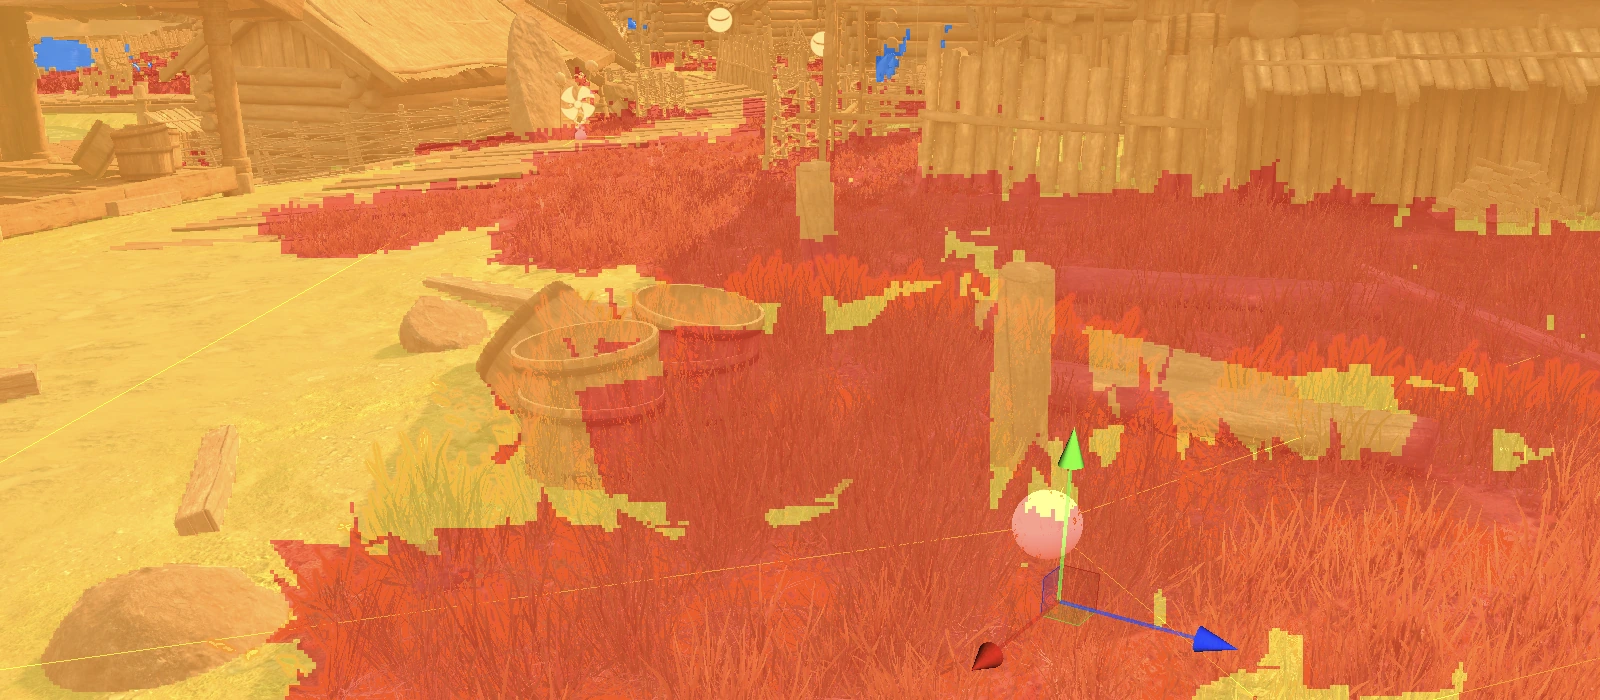
Locate materials with higher source-complexity indicators. Use the pattern to choose a shader to research and test.
Source estimateReal captures from Viking Village. Camera positions differ between examples; these are different views, not a before-and-after comparison.
Break down the workload
Turn a visual finding into a focused investigation. Group the scene, identify the heavy contributors, and open the evidence for an individual object.
Rankings use available rendering signals to guide investigation, not exact GPU milliseconds per renderer.
Investigate geometry and LODs
Find missing LOD coverage and transitions that barely reduce geometry. See where your LOD setup deserves attention.
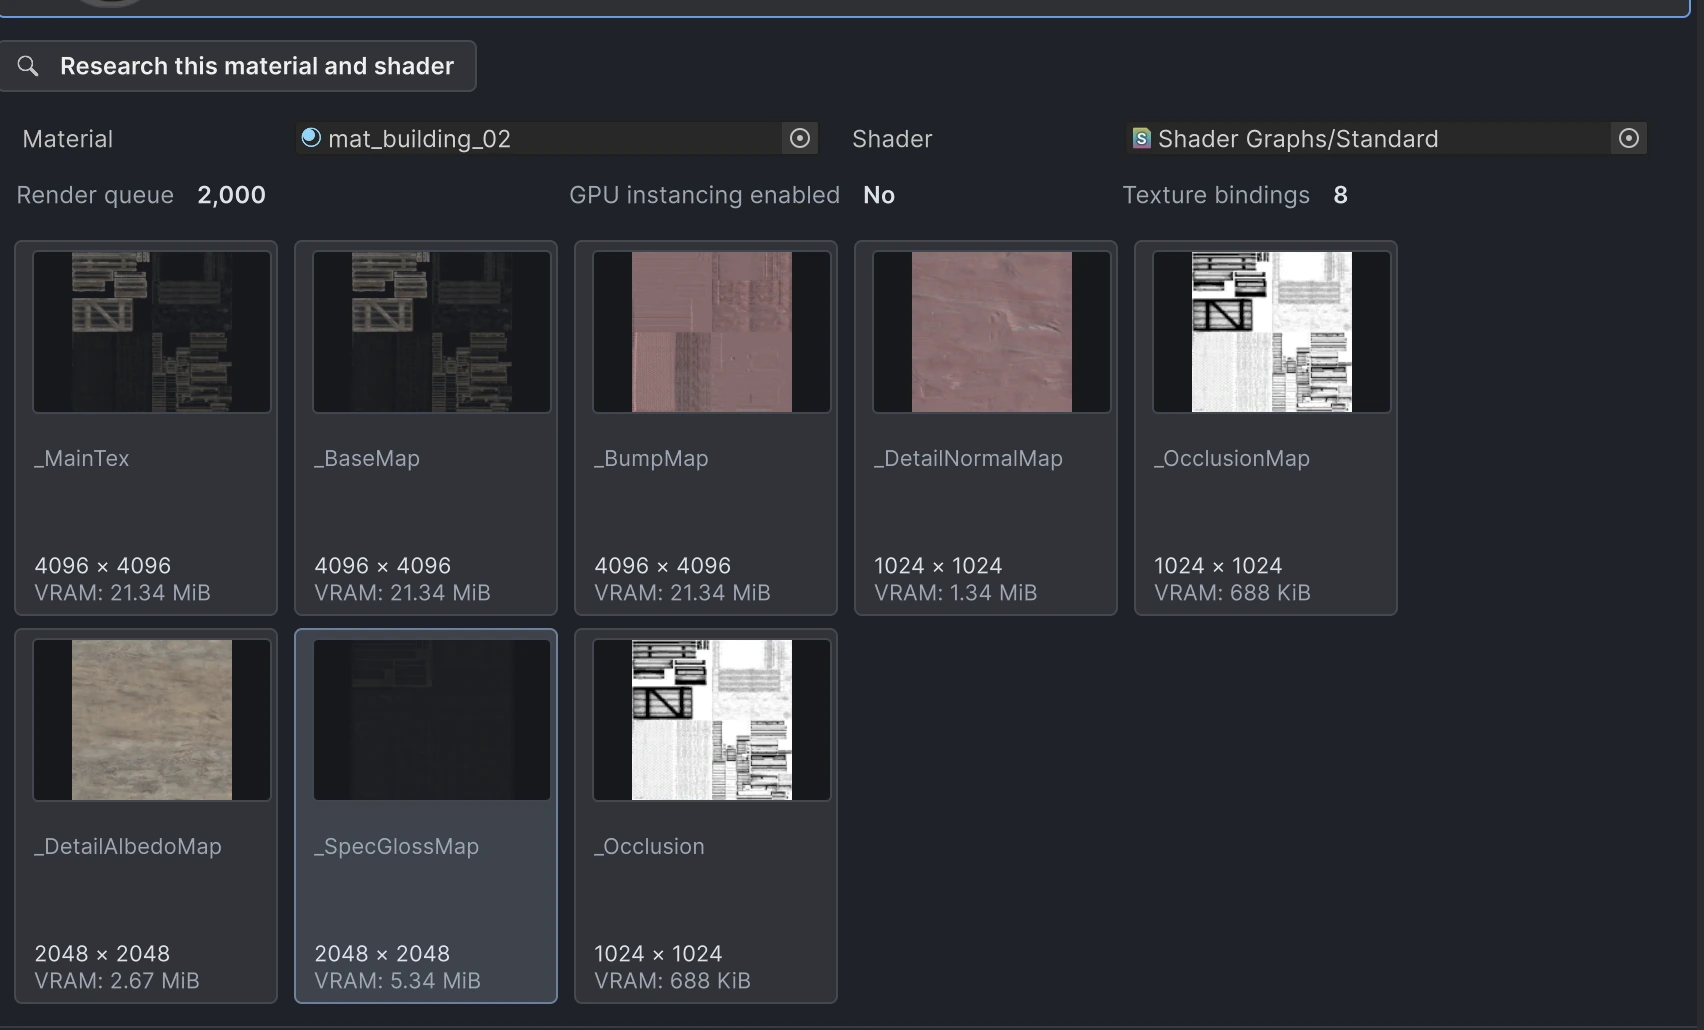
Inspect textures and texel density
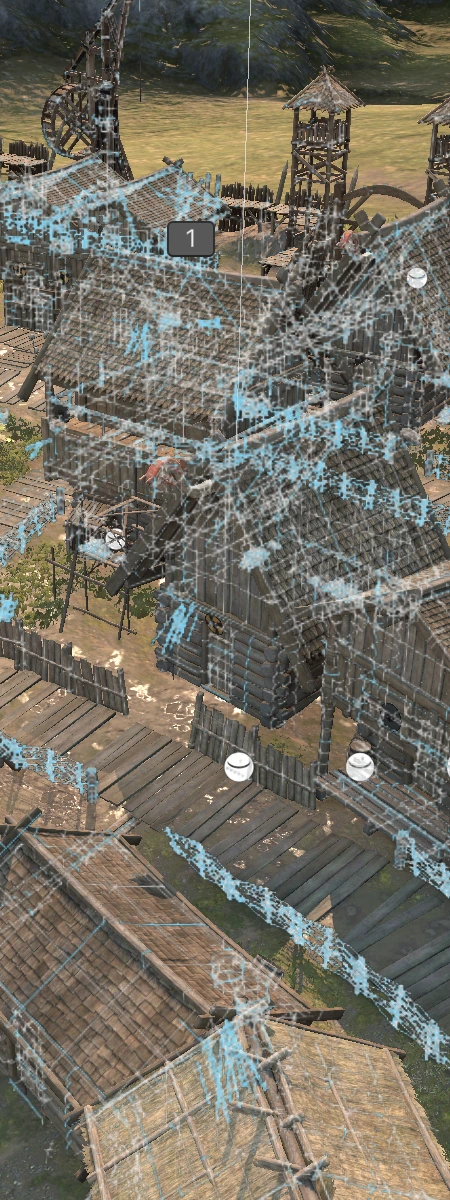
Spot inconsistent texture scale and unusual mip demand. Follow the result to the actual textures bound to a material.
Research shaders and variants
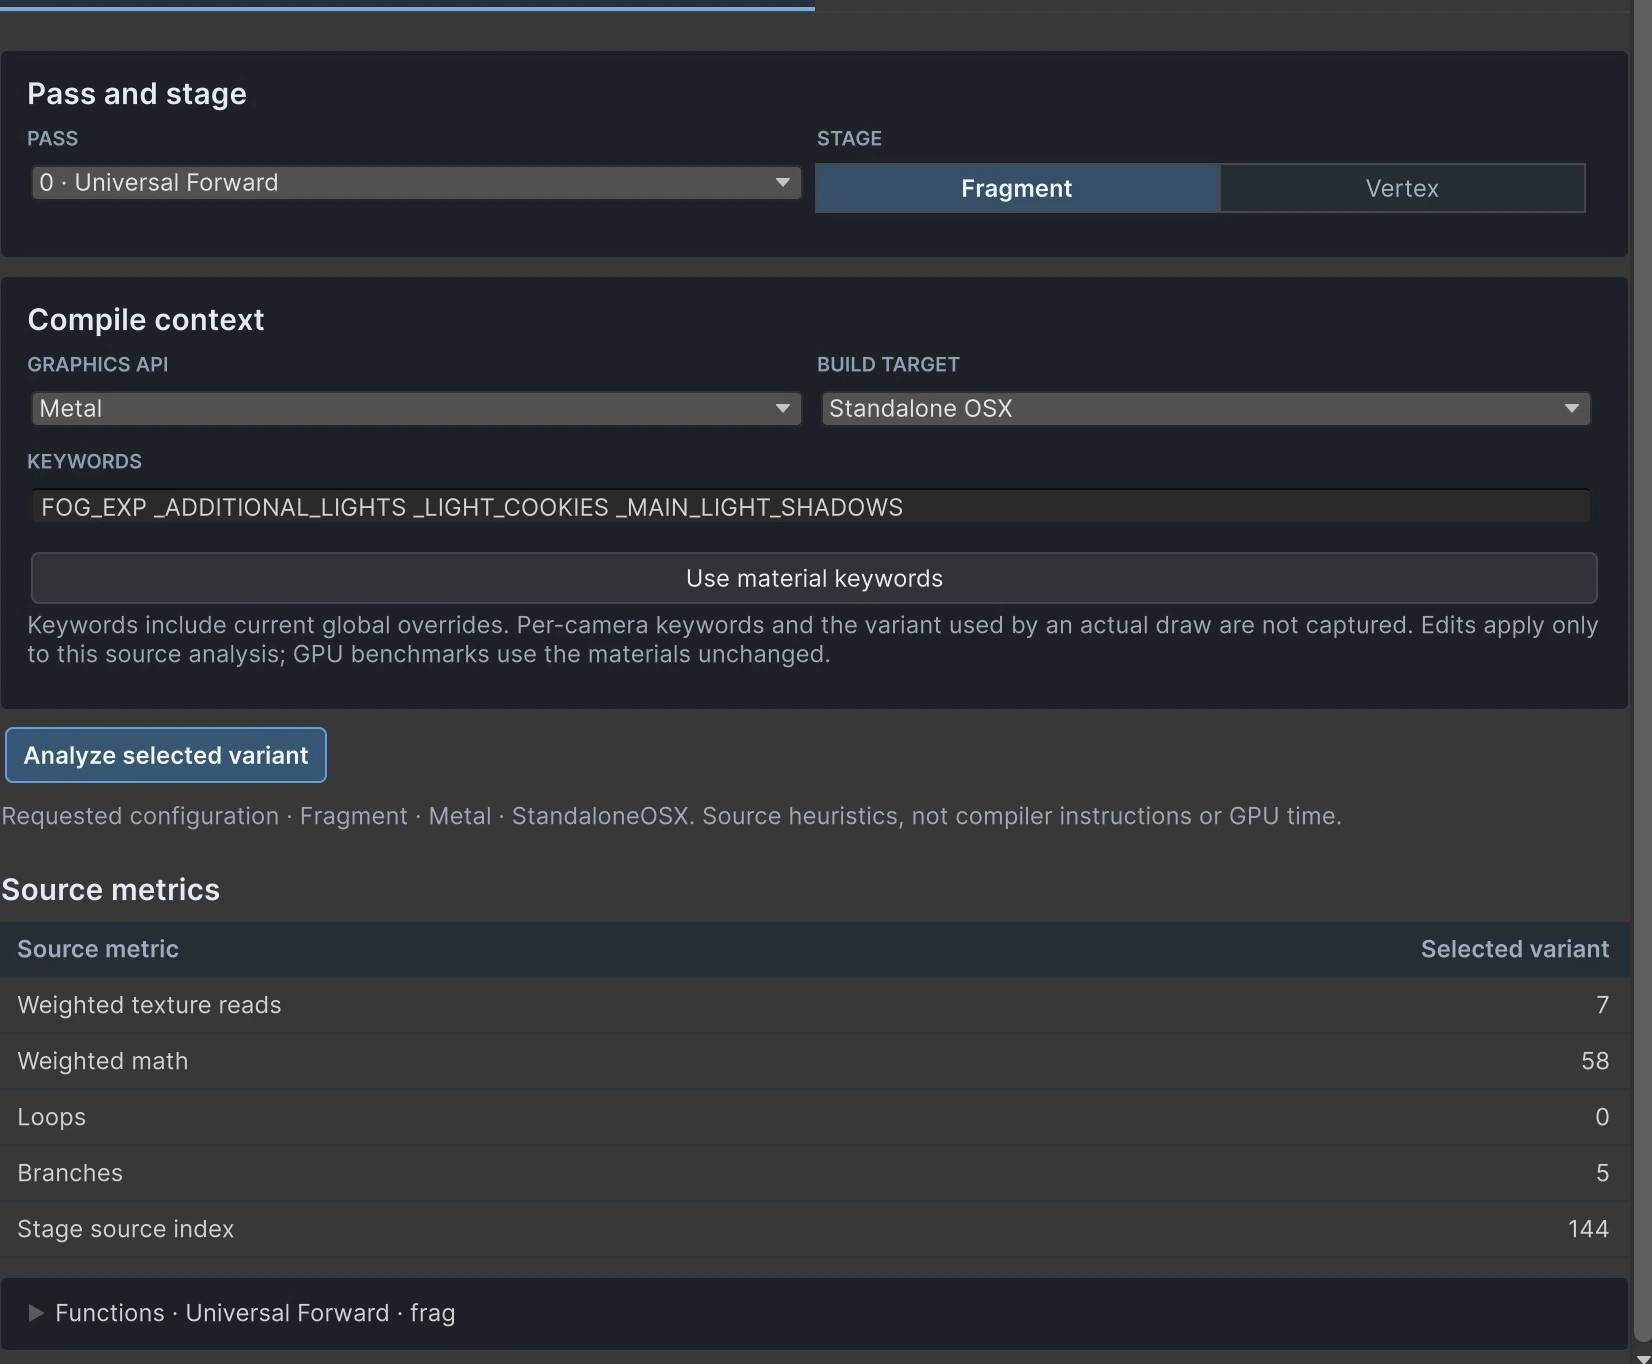
Explore what the shader source is doing. Inspect texture sampling, math, loops, branches and vertex processing, then turn the findings into a testable hypothesis.
Source complexity is a heuristic. It is not a compiled GPU instruction count or a measurement of function execution time.
Put the hypothesis to a GPU test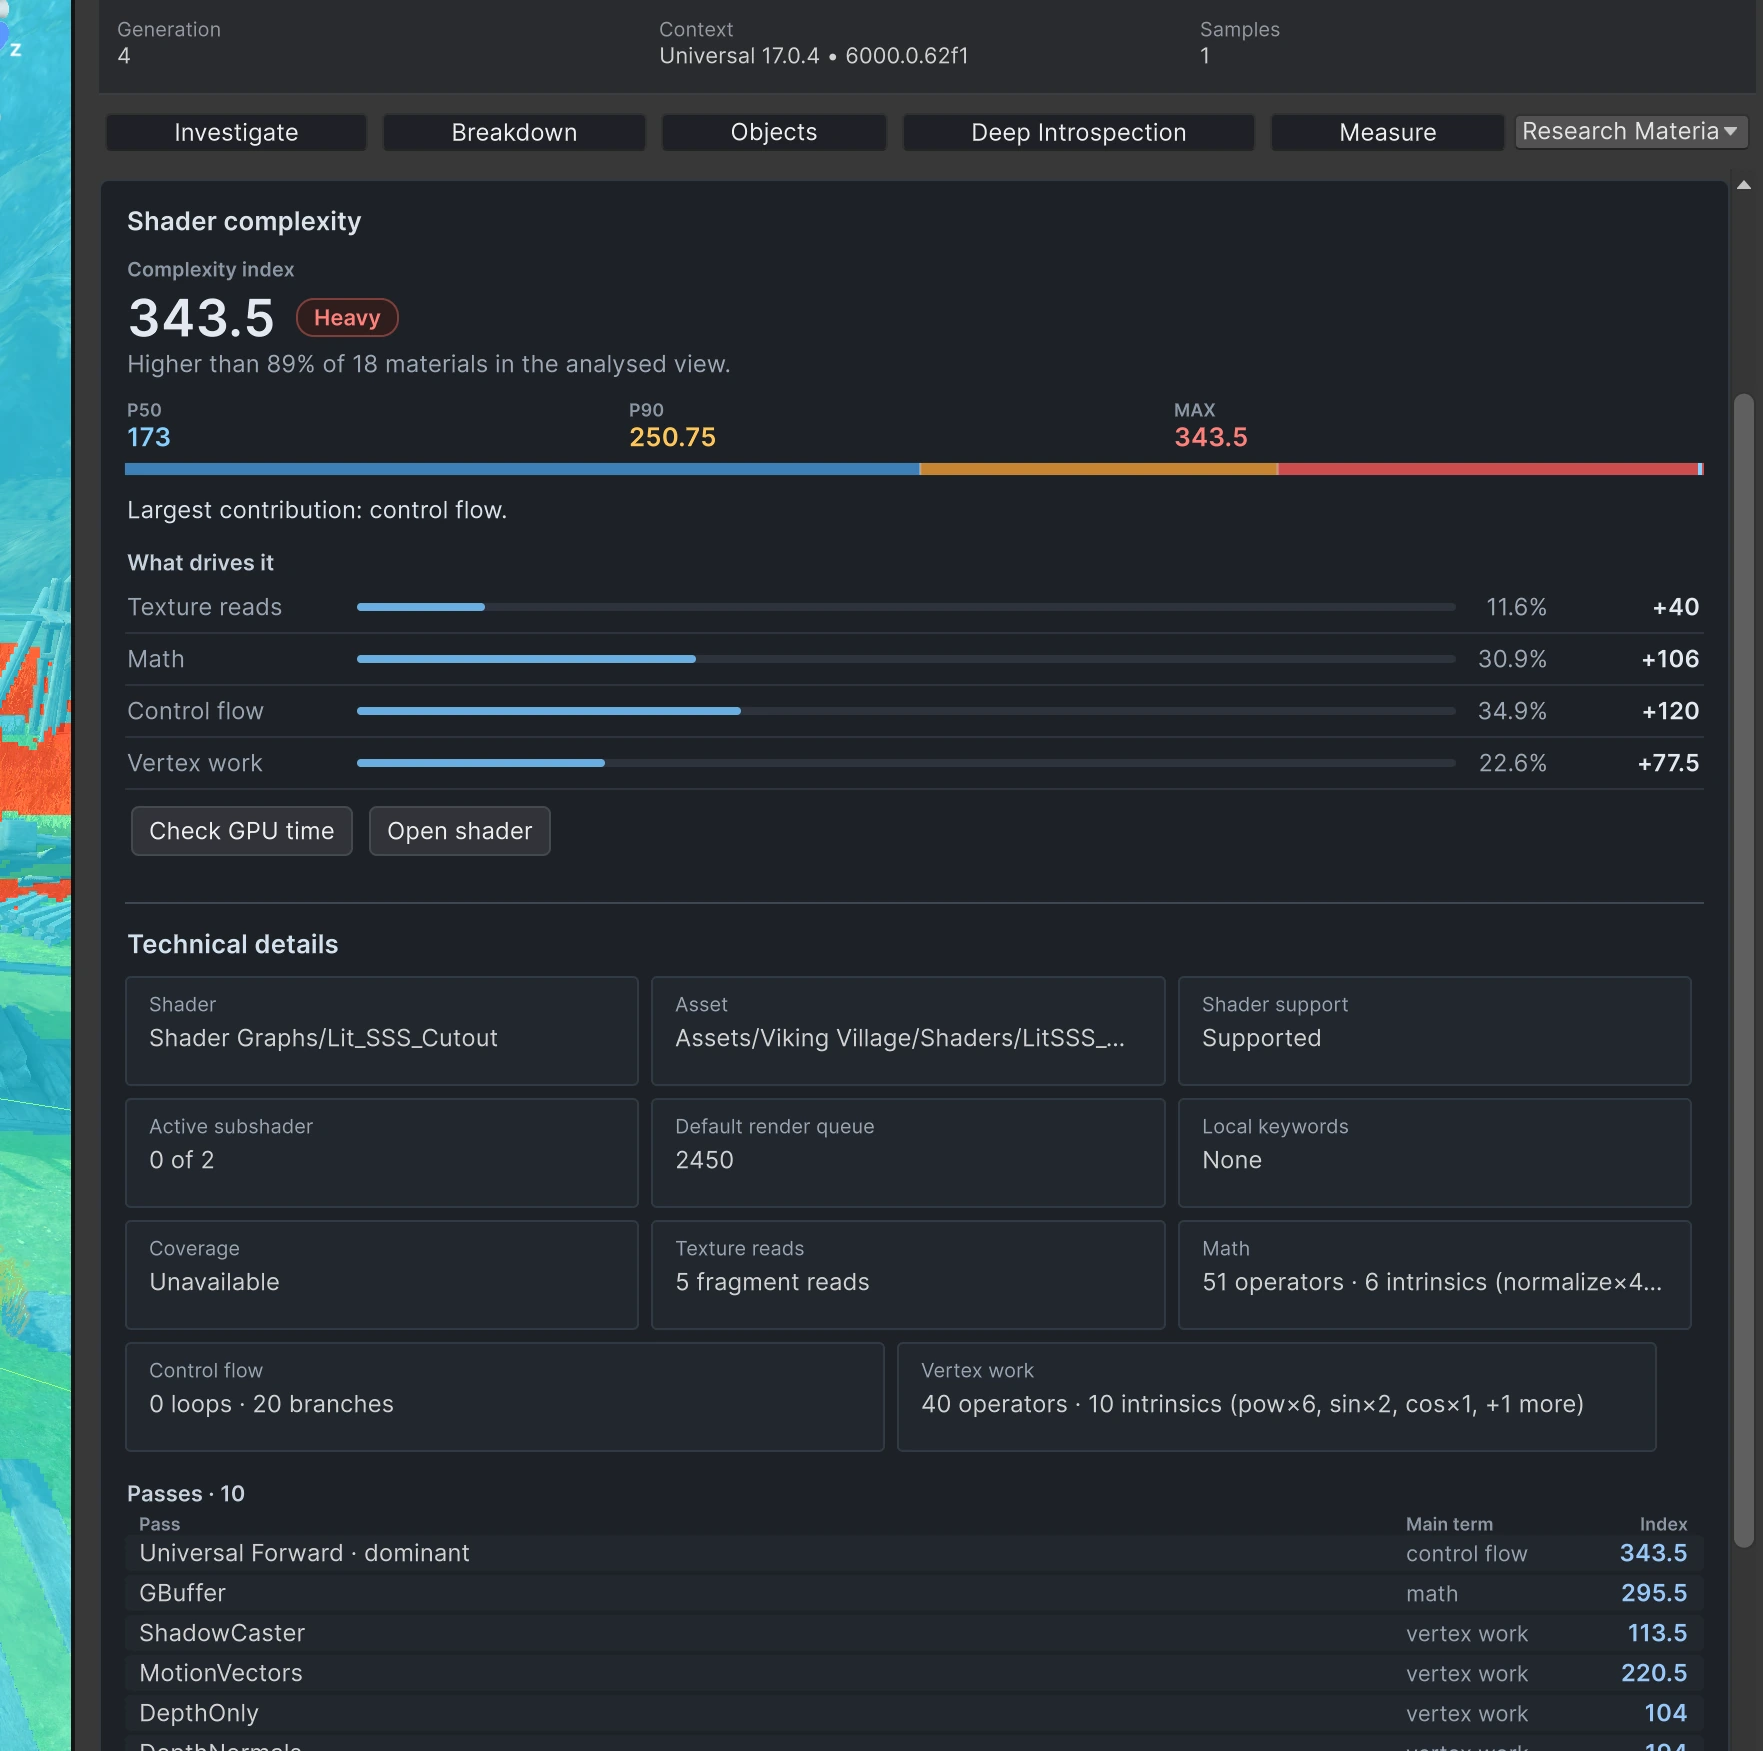
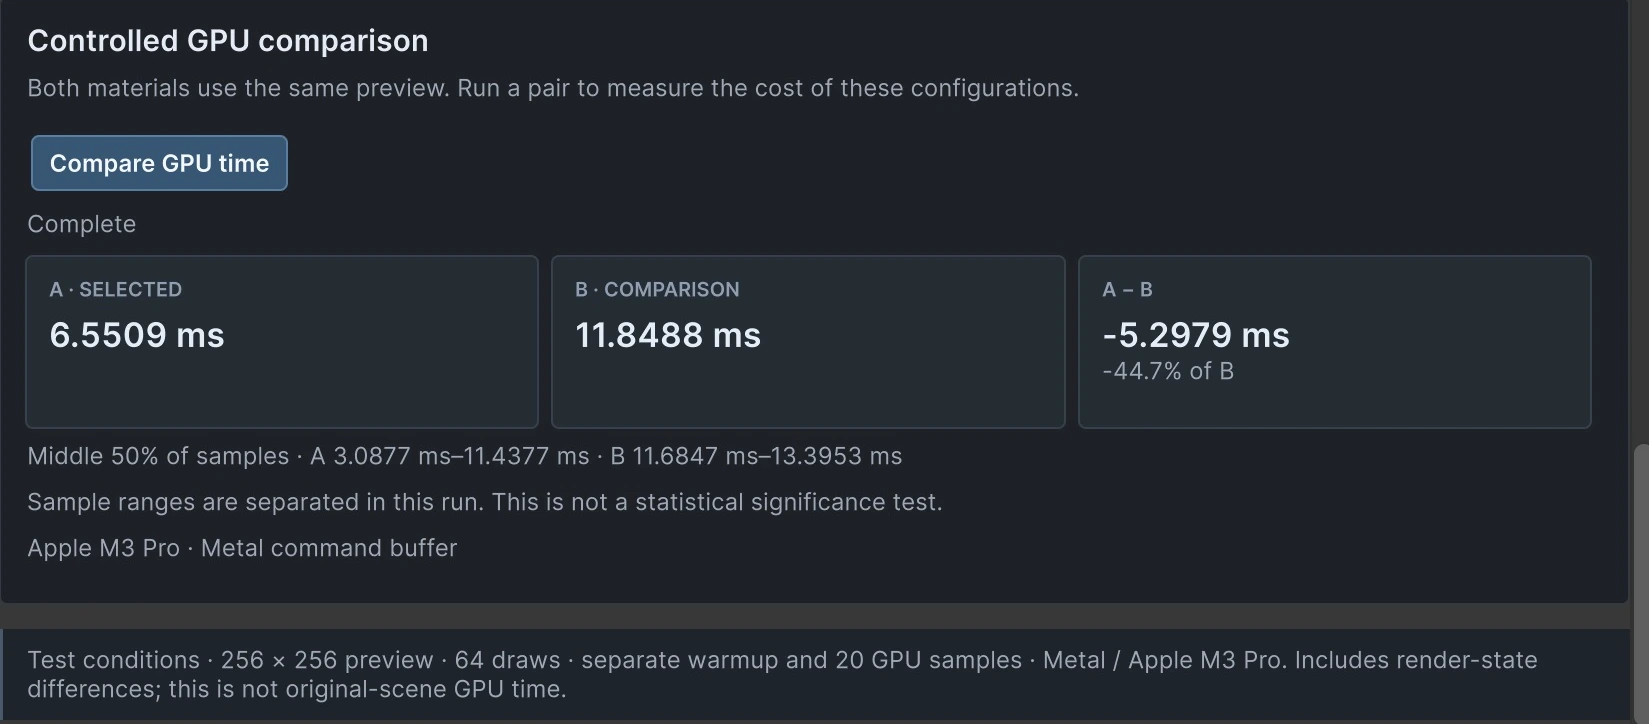
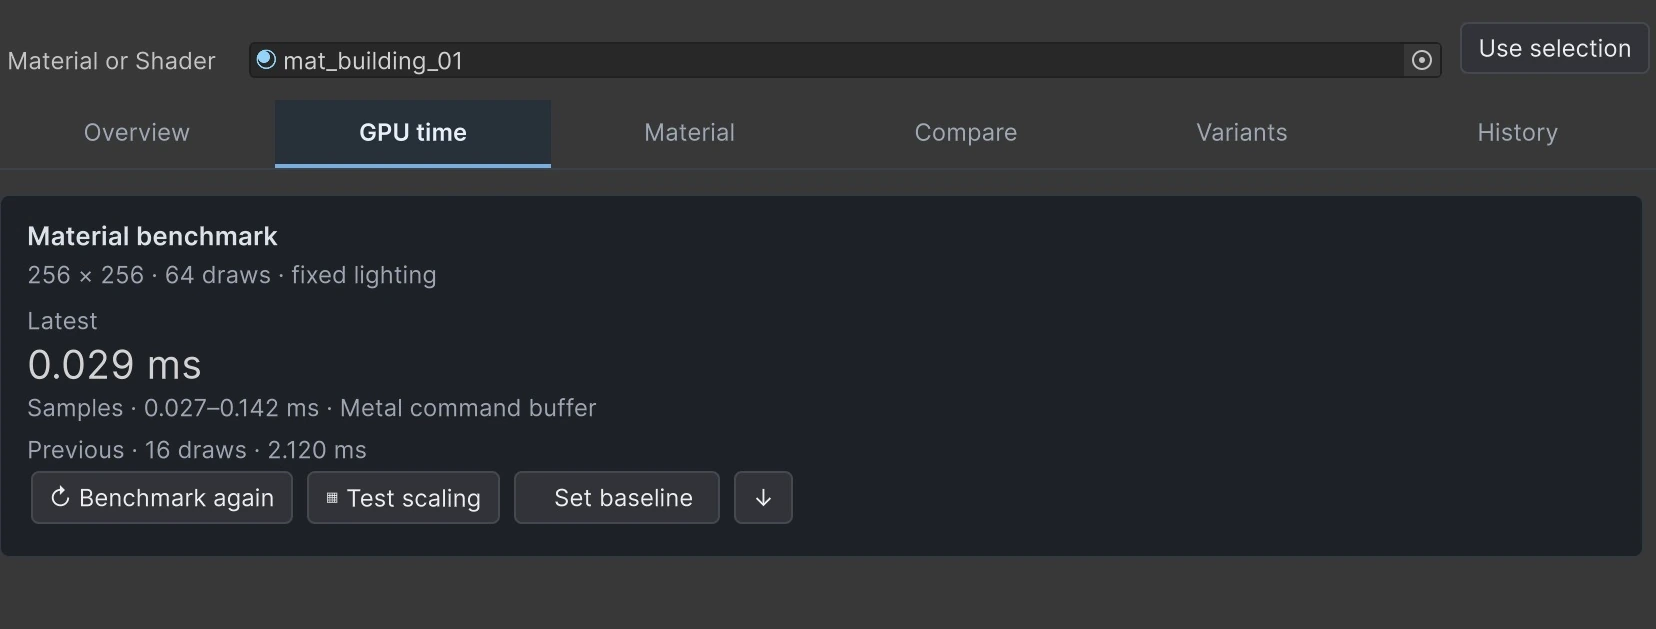
Benchmark and compare materials
Compare material configurations in a controlled preview. Keep the conditions visible, preserve a baseline, and investigate how the workload scales.
Review the differences between A and B, then compare their GPU timings under the same preview conditions.
Benchmarks require active URP and a supported timing backend. Results belong to the controlled preview workload.
Run grouped scenarios that vary resolution, draw count and geometry. Use the results to investigate what your material's preview workload is sensitive to.
This recorded run includes variability. Scaling tests support investigation; they do not automatically diagnose the bottleneck of your scene.
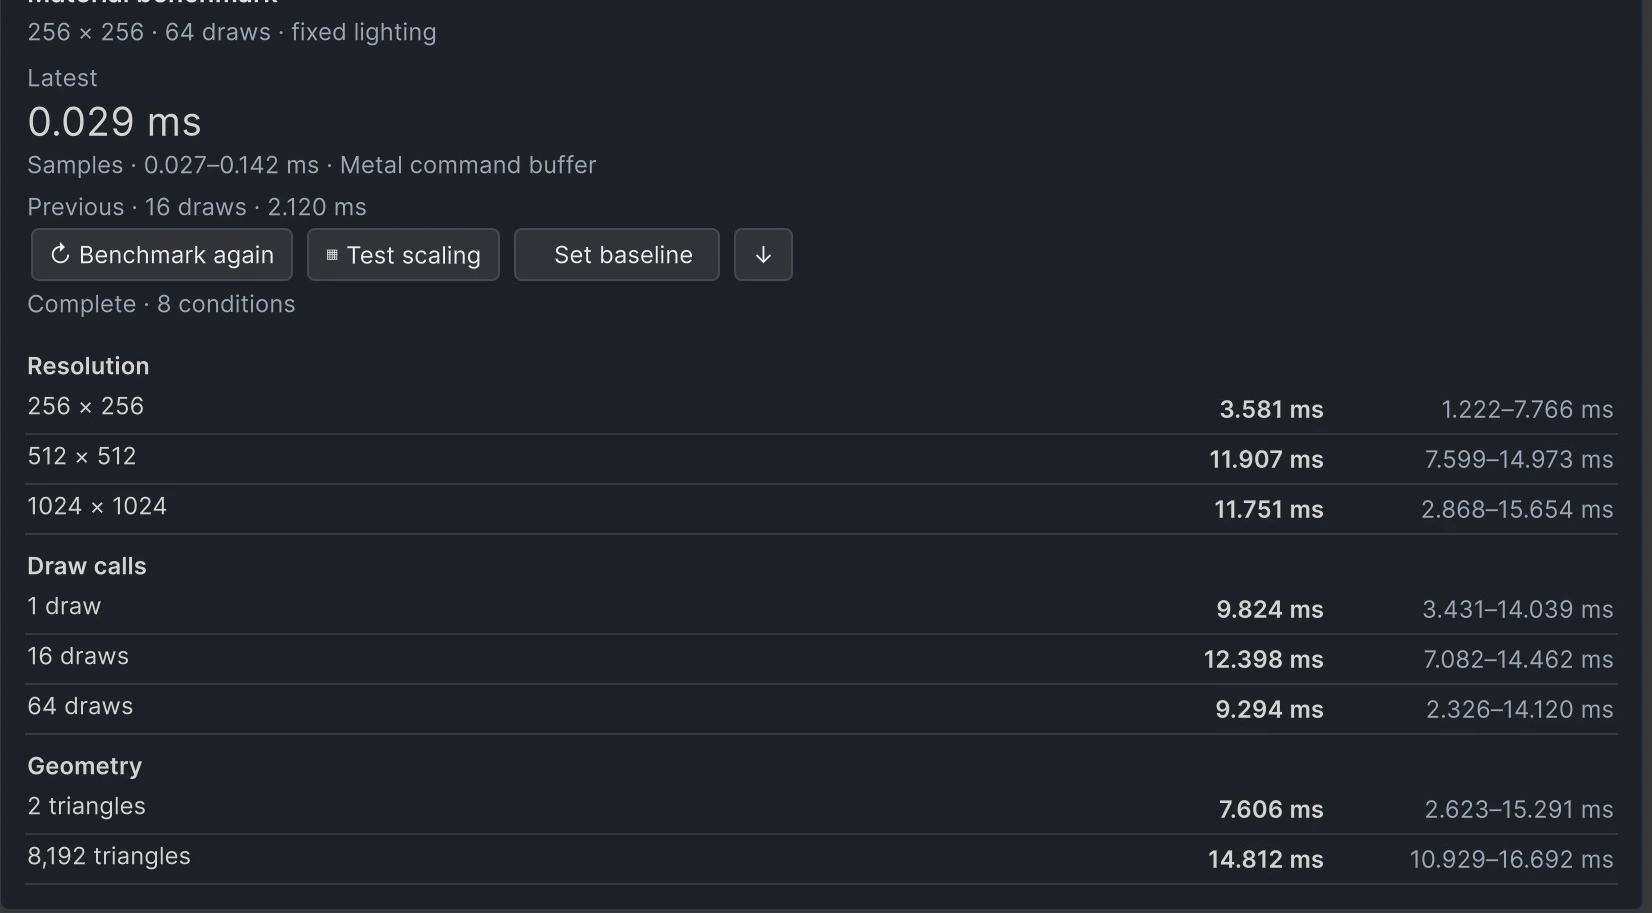
Preserve a completed material benchmark as a baseline. After a change, compare compatible runs and export the report as JSON.
A material baseline is separate from a scene snapshot. Both retain evidence and its original context.
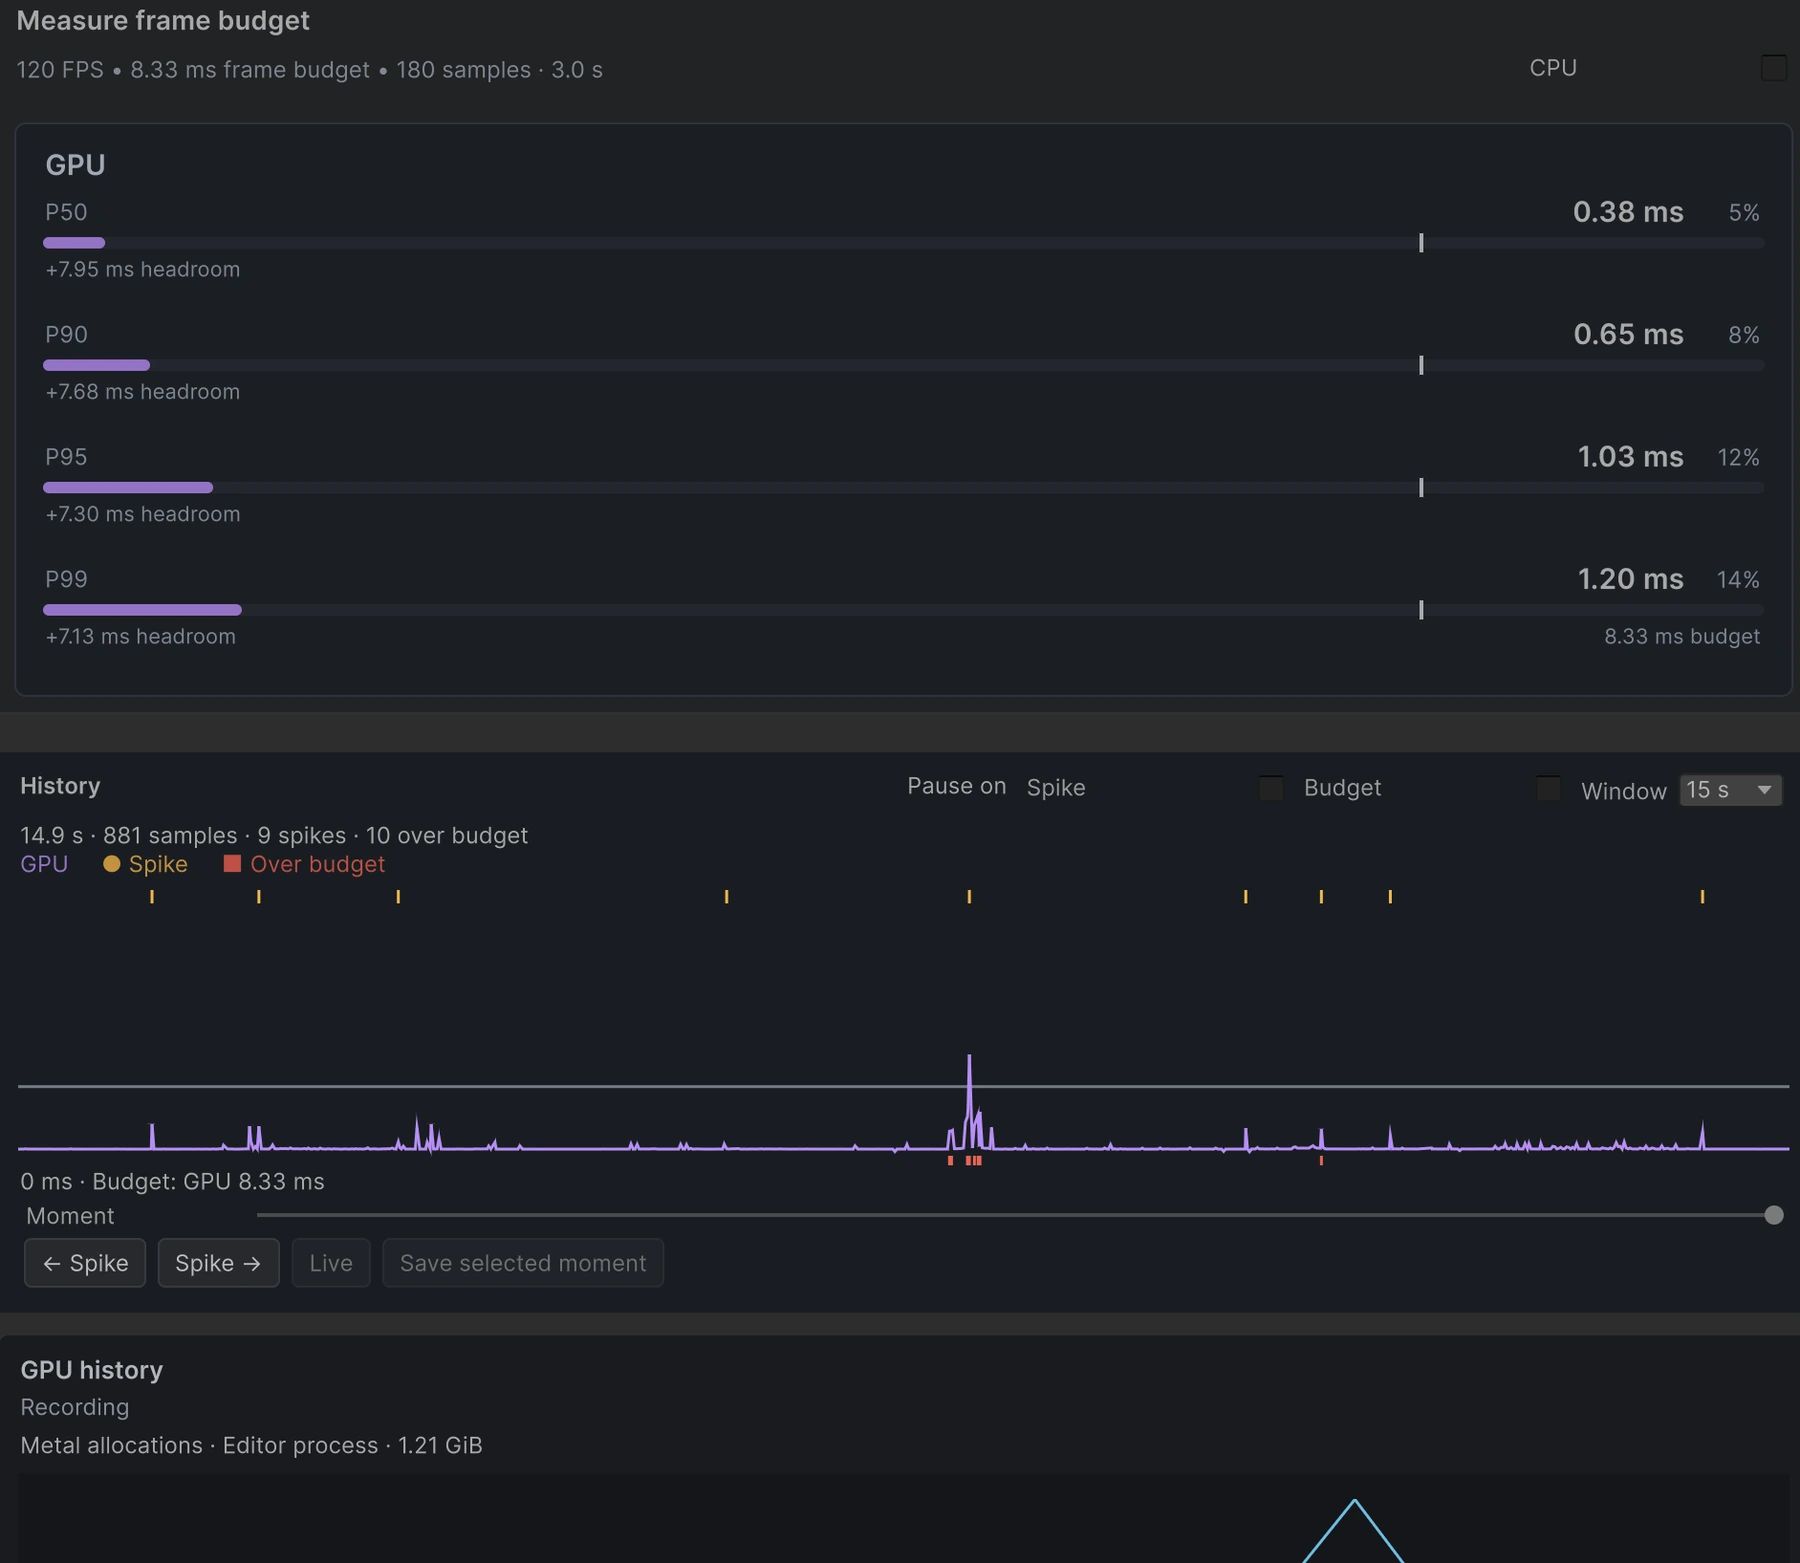
Measure frame times and spikes
Record available CPU and GPU frame timings in Play Mode. Inspect slow frames and timing history to understand stability against your target budget.
Timing availability depends on the platform and graphics backend. These are frame-level timings, not GPU time attributed to scene objects.
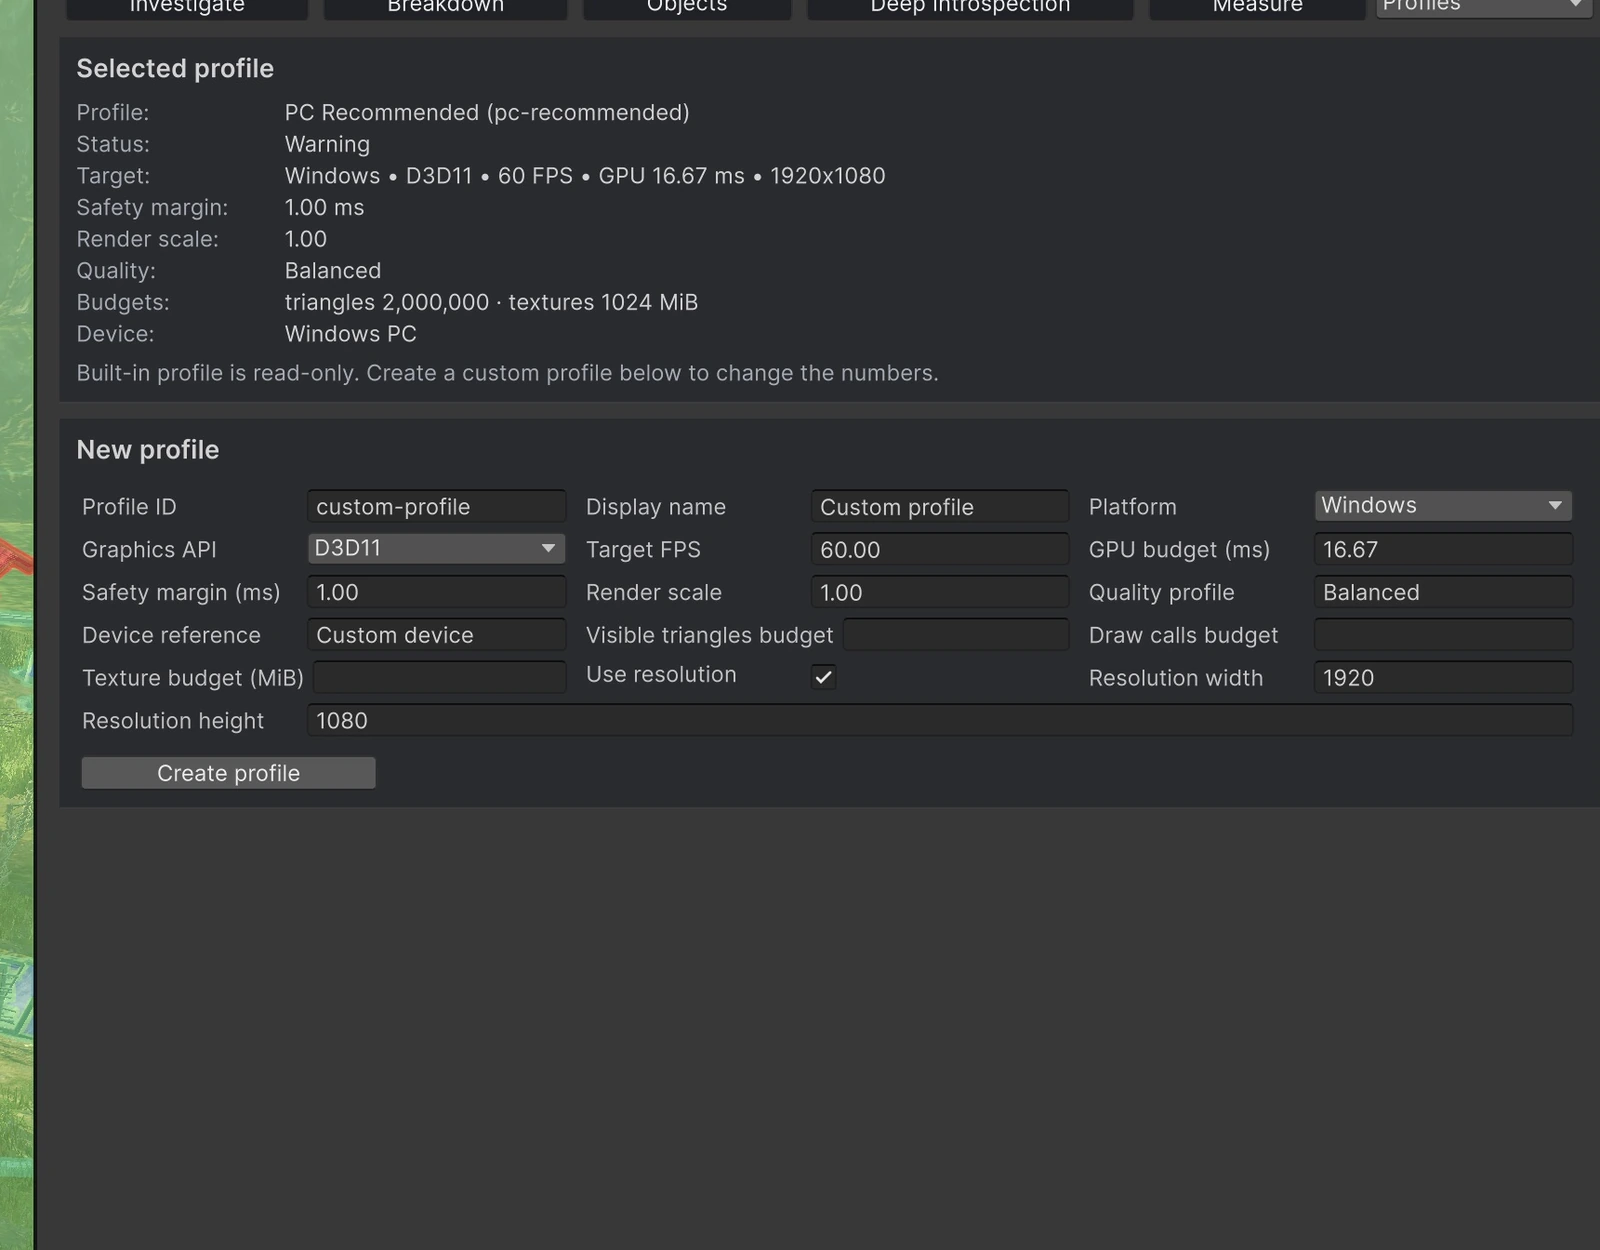
Set performance targets
Use built-in or custom profiles to set frame-time and workload targets. Profiles define your goals; they do not emulate hardware.
Save, compare and share
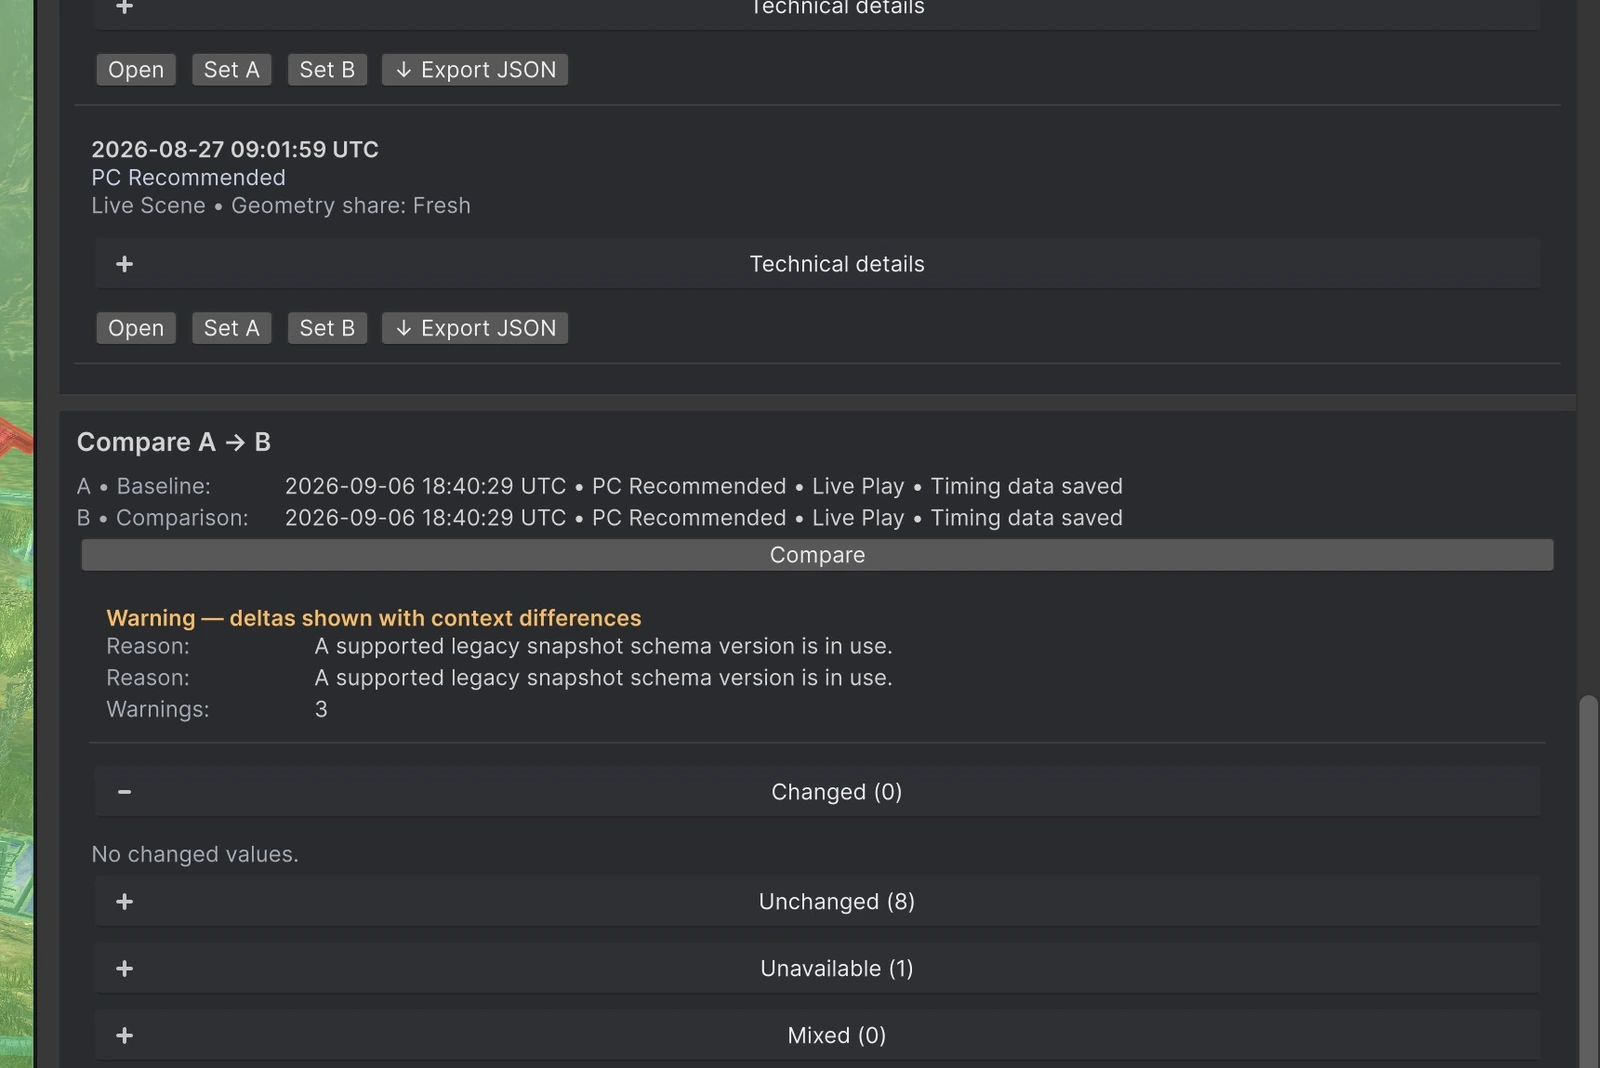
Save snapshots, compare compatible evidence, and share JSON reports. Incompatible or unavailable results stay visible in the comparison.
One connected workflow
For solo developers, technical artists and game teams. Start with a first performance pass and follow the same evidence into a deeper investigation.
Use scene maps and grouped contributors to choose the object or material worth investigating.
Explore the maps ↗Inspect object evidence, research the shader and benchmark a candidate material configuration.
Explore shader research ↗Record frame timings in the real scene, compare compatible snapshots and share your findings.
Explore measurement ↗Know what the results mean
Follow a visual guide
Go from your first scene investigation to material research, measurements and comparisons with the illustrated English user guide.
A few useful details
Requirements, measurement boundaries and where GPUSight fits in your workflow.
Talk to us on DiscordGPUSight helps you investigate rendering workloads: geometry and LODs, coverage and overdraw, materials, shader source, textures, and frame-time stability. Use its maps and breakdowns to choose what to investigate, then compare evidence after an intentional change. It does not automatically modify or optimize your assets.
No. Workload rankings, geometry shares and shader-source complexity guide investigation; they are not exact per-renderer GPU milliseconds. Material benchmarks measure a controlled preview workload. Play Mode timings are frame-level and are not attributed to individual objects. GPU pressure is not a GPU utilization percentage.
The current release workflow has been checked with Unity 2022.3.62f3 + URP 14.0.12 and Unity 6000.0.62f1 + URP 17.0.4. Scene View analysis includes Built-in, URP and HDRP paths, but individual features have separate requirements. These checks do not certify every Unity, pipeline or graphics API combination.
Material preview benchmarks require active URP, a supported material and an available GPU timing backend. Native texture-allocation inventory currently requires Metal. Play Mode CPU and GPU timing availability depends on the platform, graphics API and timing source. The guide describes feature-specific requirements.
No. Built-in and custom profiles define performance targets and budgets. Selecting a profile does not emulate hardware or move the benchmark to another device. Controlled preview tests run on the actual host device and graphics backend.
GPUSight complements Unity Profiler, Frame Debugger and RenderDoc. It connects scene investigation, object evidence, shader research and comparisons. New RenderDoc deep capture and remote Player Session workflows are not available in this release.
Yes. Export and import snapshot JSON to share captured evidence and its context, or export material benchmark reports. Snapshots preserve available results and identify incompatible comparisons; they do not package your Unity project or create a new measurement.
GPUSight for Unity
From a scene-wide pattern to a specific material.
From a hypothesis to evidence you can compare.